


With the recent surge in inflation since the spring there has been an increase in consumers’ short-run (one-year ahead) and, to a lesser extent, medium-run (three-year ahead) inflation expectations (see Survey of Consumer Expectations). Although this rise in short- and medium-run inflation expectations is relevant for policymakers, it does not provide direct evidence about “un-anchoring” of long-run inflation expectations. Roughly speaking, inflation expectations are considered un-anchored when long-run inflation expectations change significantly in response to developments in inflation or other economic variables, and begin to move away from levels consistent with the central bank’s (implicit or explicit) inflation objective. In that case, actual inflation can become unmoored and risks drifting persistently away from the central bank’s objective. Well-anchored long-run inflation expectations therefore represent an important measure of the success of monetary policy. In this post, we look at the current anchoring of consumers’ long-run inflation expectations using novel data from the Survey of Consumer Expectations (SCE). Our results suggest that in August 2021 consumers’ five-year ahead inflation expectations were as well anchored as they were two years ago, before the start of the pandemic.
The Survey of Consumer Expectations is a monthly, internet-based survey produced by the Federal Reserve Bank of New York since June 2013. It is a twelve-month rotating panel (respondents are asked to take the survey for twelve consecutive months) of roughly 1,300 nationally representative U.S. household heads. The SCE consists of a “core monthly survey,” in which we ask the same set of questions, and special surveys conducted on an ad-hoc basis to address timely questions. We focus here on three special surveys we conducted in July 2019, April 2021, and August 2021 in which we elicited consumers’ short- and long-run inflation expectations.
To measure short-run inflation expectations, we asked respondents “What do you expect the rate of [inflation/deflation] to be over the next 12 months?” To measure long-run inflation expectations, we asked respondents the same question, but we replaced “Over the next 12 months” with “Over the 12-month period between M+48 and M+60,” where M is the month in which the respondent takes the survey. So, for instance, a respondent taking the survey in August 2021 was asked about inflation “Over the 12-month period between August 2025 and August 2026.” Additional information regarding the survey and question wording can be found in this Economic Policy Review article.
We report in the table below the median point forecast in each survey at the two horizons. We see an increase in the median one-year ahead inflation expectation between July 2019 and April 2021 (from 2.92 percent to 3.24 percent), followed by a sharp rise (from 3.24 percent to 4.84 percent) in the four months that separated the April and August 2021 surveys. In the special surveys, respondents were also asked for the reason(s) that led to this sharp increase. Overwhelmingly, they mentioned it was driven primarily by their own experience with higher prices during that period.
In sharp contrast, the same table indicates that the median five-year ahead inflation point prediction remained unchanged at 3.00 percent between July 2019 and April 2021, and increased only modestly between April and August 2021 (to 3.16 percent). Thus, it appears that, similar to financial market participants and professional forecasters, the recent surge in actual inflation had little impact on the long-run inflation expectation of the median U.S. consumer.
Median Short-Run and Long-Run Inflation Expectations
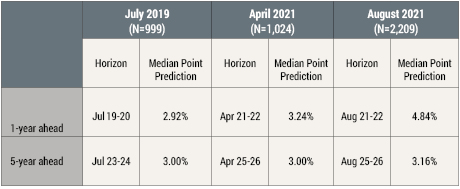
Source: Federal Reserve Bank of New York Survey of Consumer Expectations (2013-2021).
Note: The medians reported are interpolated medians computed using the iquantile module (Cox 2009) in Stata.
Having compared the central tendencies across the three surveys, we now compare the entire distribution of inflation expectations across all respondents. To do so, we plot in the chart below the proportion of respondents who report inflation point predictions in different bins, focusing on the region between -3 percent inflation (or 3 percent deflation) and 9 percent inflation. The left panel is for one-year ahead inflation expectations, while the right panel is for five-year ahead. The gray bars are for the July 2019 survey, the gold bars for the April 2021 survey, and the blue bars for the August 2021 survey.
Starting with the distribution of one-year inflation expectations in the left panel, we can see a clear shift to the right, that is toward higher inflation values, between 2019 and 2021. In particular, the proportion of respondents who expect inflation a year from now to be between 1 percent and 3 percent dropped from 41 percent in July 2019 to 18 percent in August 2021. Meanwhile, the proportion of respondents who expect inflation a year from now to be between 5 percent and 7 percent more than doubled (from 12 percent to 28 percent) during the same period.
In sharp contrast, the distributions of five-year ahead inflation expectations in the right panel of the chart below remained remarkably similar across the three surveys we conducted over the past two years. Indeed, while we see small differences in the proportion of respondents who expect inflation five years from now to be between 1 percent and 3 percent, no clear pattern emerged in the right panel of the chart. Thus, our survey results not only suggest that the median long-run inflation expectation of consumers changed little over the past two years, but also that the entire distribution of long-run inflation expectations changed little.
Distributions of Short-Run and Long-Run Inflation Expectations
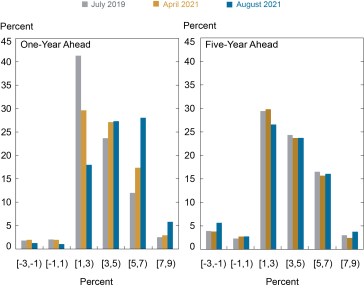
Source: Federal Reserve Bank of New York Survey of Consumer Expectations (July 2019, April 2021, August 2021).
Note: Responses less than -3 percent and greater than or equal to 9 percent are excluded in the chart. Percentages on the vertical axis represent percentage of the entire sample.
Does this imply that respondents did not revise their long-run inflation expectations at all during the past two years? To answer this question, we focus on the subset of 674 respondents who completed both the July 2019 and August 2021 surveys. We find that while 19 percent of these repeat respondents reported exactly the same long-run inflation expectations two years apart, most respondents changed their five-year ahead inflation expectations between 2019 and 2021, as may be expected given the unprecedented events over this period. These changes, however, are nearly symmetric with an almost equal number of respondents revising their long-run inflation expectations upward and downward. Although downward revisions may seem surprising in the current, high-inflation environment, they are consistent with a few commentators highlighting the risk that longer-running structural factors, which have led to declines in inflation and inflation expectations in recent pre-pandemic years, could resume once current supply disruptions and the extraordinary relative price movements induced by the pandemic have run their course.
Our special surveys provide additional evidence that long-run inflation expectations are as well anchored in 2021 as they were in 2019. In particular, we conducted a series of experiments in which we measured the sensitivity of five-year ahead inflation expectations to persistent hypothetical shocks to past inflation and to hypothetical surprises in future near-term inflation. For instance, respondents were asked to report how their five-year ahead inflation expectations would change if “in each of the past three years inflation had been lower than it actually was by 1 percent each year” or if “the rate of inflation over the next 12 months turns out to be 1% higher than you [currently expect]?” The results of these experiments indicate modest revisions in long-run inflation expectations in all treatments, and revisions of similar magnitude in the surveys conducted in 2019 and in 2021. Further, the proportion of respondents who appear to have perfectly anchored inflation expectations (in the sense that their long-term inflation beliefs were completely unresponsive to inflation shocks) remained remarkably stable around 40 percent over the past two years.

Oliver Armantier is an assistant vice president in the Federal Reserve Bank of New York’s Research and Statistics Group.

Fatima Boumahdi is a senior research analyst in the Bank’s Research and Statistics Group.

Leo Goldman is a senior research analyst in the Bank’s Research and Statistics Group.

Gizem Koşar is an senior economist in the Bank’s Research and Statistics Group.

Jessica Lu is a senior research analyst in the Bank’s Research and Statistics Group.

Giorgio Topa is a vice president in the Bank’s Research and Statistics Group.

Wilbert van der Klaauw is a senior vice president in the Bank’s Research and Statistics Group.
Disclaimer
The views expressed in this post are those of the authors and do not necessarily reflect the position of the Federal Reserve Bank of New York or the Federal Reserve System. Any errors or omissions are the responsibility of the authors.
 RSS Feed
 Follow Liberty Street Economics